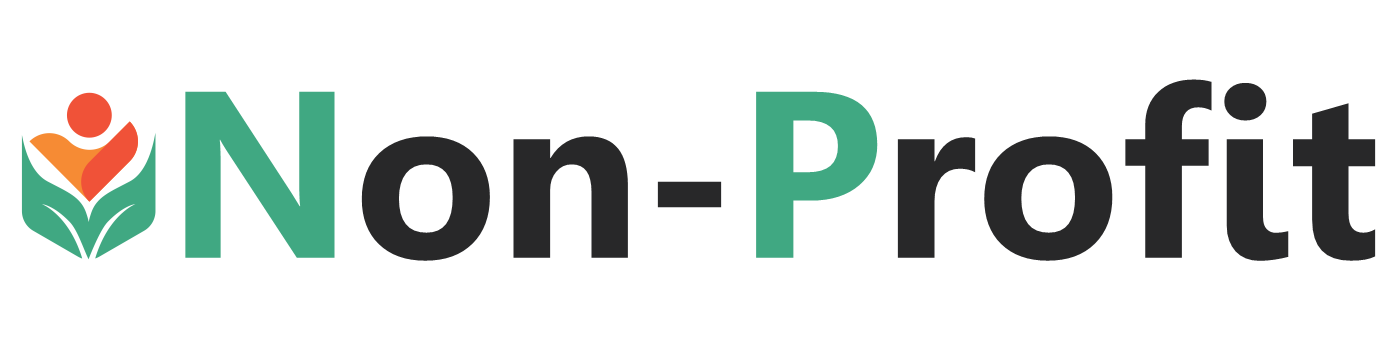
Millennials are a tough bunch to appeal to. Born between the early 80's and late 90’s, this hyper-co
Read More

TRENDS ON $5 MILLION IN SANDY RELIEF GIVING Network for Good is the leading digital giving platform.
Read More

The biggest challenge that nonprofits face is spreading the word about their cause. Having a strong
Read More
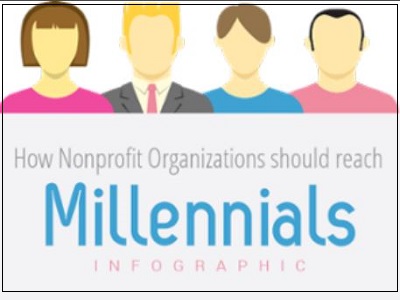
And increae the sucess of their Email Marketing Programs.
Nonprofits rely heavily on email market
Read More
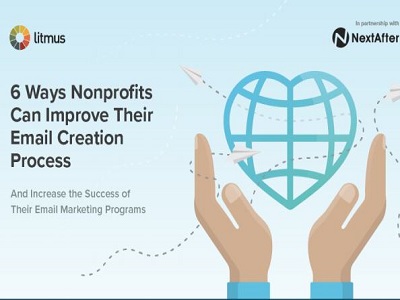
Who gives to crowdfunding campaigns and how much do they give? How are they getting to your campaign
Read More
Looking for some great fall fundraising ideas? These four will help you stand out from the competiti
Read More
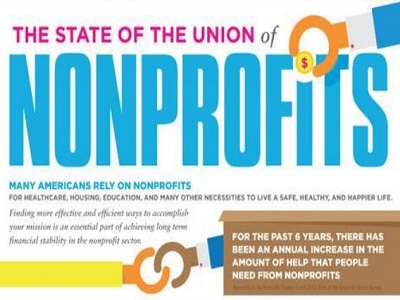
People are leaning on nonprofits more than ever recently because of the sluggish economy. Learn mor
Read More